So Democrat candidate Biden has a massive lead over the incumbent? Sounds familiar. Do the polling results show much difference between 2020 and 2016?
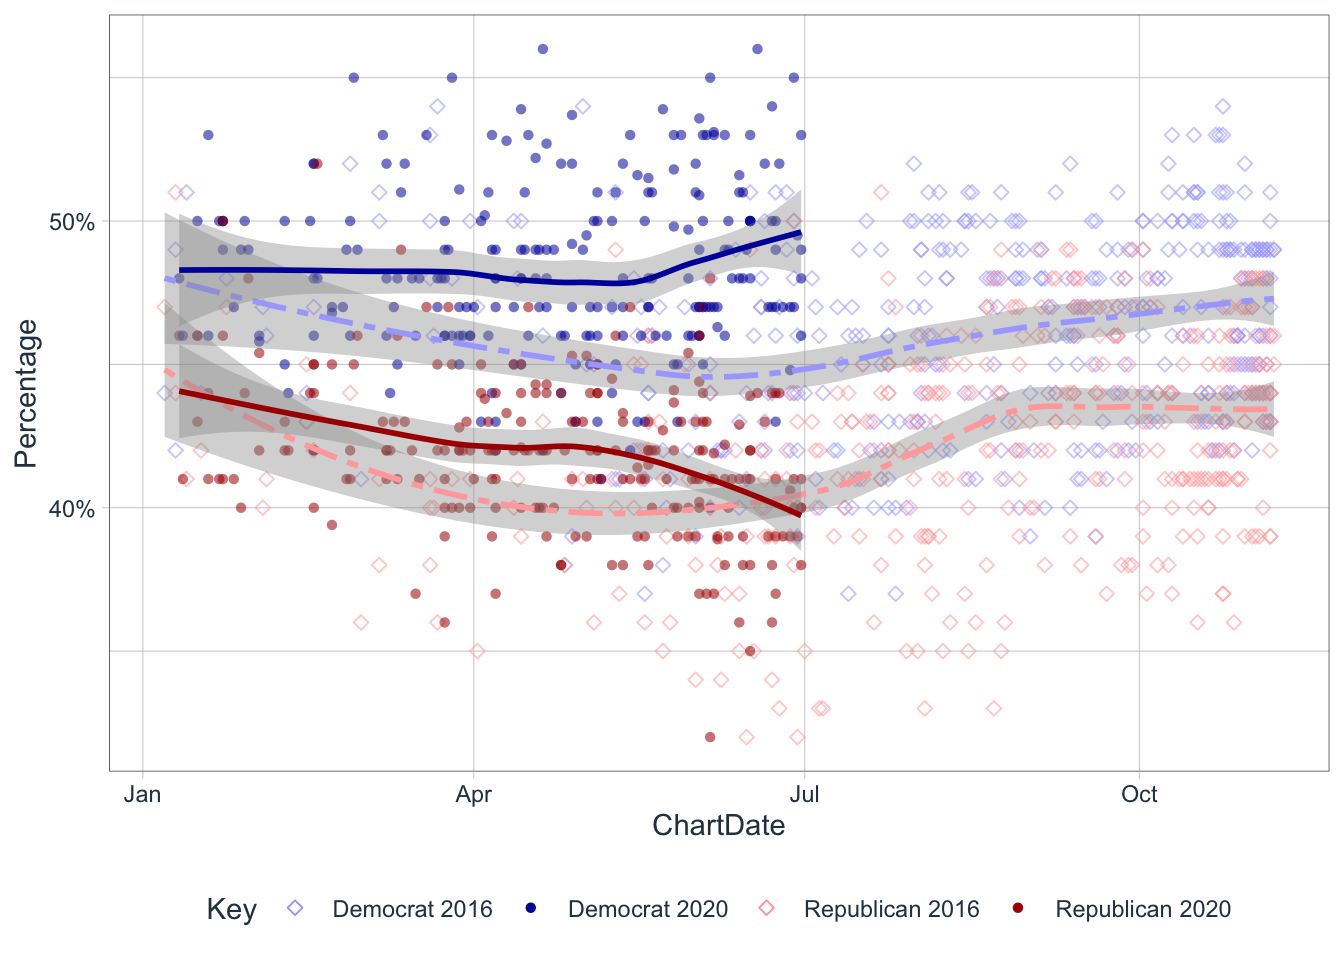
Biden is getting better percentages than Clinton pulled in. And Trump’s numbers are tanking. Enough for some optimism amongst democarts but not enough for complancency.
For actual insight fivethirtyeight.com reliably deliver with authority and flair. But in our relentless pursuit of data and R mastery, we have to give it a go ourselves.
Where can data be obtained?
- fivethirtyeight, 2020, perfect - but nothing for 2016
- wikipedia, 2016, awkward and inconsistent formatting
- wikipedia, 2020, awkward and inconsistent formatting
- realclearpolitics, 2020
- realclearpolitics, 2016, awkward and inconsistent formatting
The only dataset which covers both elections is Wikipedia, so not much choice.
library(readxl)
library(tidyverse)
library(lubridate)
# library(plyr)
library(tidyquant)- Setup a data structure for the project
- Point to folder containing data and any other assests
use <- list()  # (us election)
use$folder <- "/folder/containing/csv/data"- Ive copied the wikipedia pages into a open office spreadsheet, exported it to xls.
- Inspect the xls.
Read the three sheets
use$ws <- list() # worksheets
use$ws$e2020 <- read_excel(use$filename, use$sheetNames[1])
use$ws$e2016postConvention <- read_excel(use$filename, use$sheetNames[2])
use$ws$e2016preConvention <- read_excel(use$filename, use$sheetNames[3])
inspect the data
glimpse(use$ws$e2020)## Rows: 340
## Columns: 8
## $ `Poll source` <chr> "Ipsos/Reuters", "YouGov/Economist", "IBD/TIPP", "…
## $ Date <chr> "Jun 29-30, 2020", "Jun 28-30, 2020", "Jun 27-30, …
## $ `Sample\nsize[b]` <chr> "943 (RV)", "1,198 (RV)", "1,005 (RV)", "733 (RV)"…
## $ `Margin\nof error` <chr> "± 3.6%", "± 3.4%", "± 3.1%", "± 3.6%", "± 3.1%", …
## $ Trump <chr> "0.38", "0.40000000000000002", "0.4000000000000000…
## $ Biden <chr> "0.46000000000000002", "0.48999999999999999", "0.4…
## $ Other <chr> "10%[c]", "6%[d]", "–", "4%[e]", NA, "1%[i]", "–",…
## $ Undecided <chr> "0.059999999999999998", "0.040000000000000001", "–…A few problems
- 2016 pre convention structure differs from post convention structure.
- The date column contains a range, difficult to parse.
- There is another gotcha in date column that glimpse misses. When the date crosses a month boundary the format is different. e.g August 16 – September 12, 2016.
- Another problem not revealed by glimpse in the 2020 sheet, a few of the percentages we are interested in are annotated with letters, used like * or † for notes, this has also broken the spreadsheet export percentage representation. So for a few items instead of a decimal we have an integer followed by a letter.
Approach
- Solve structure issues with trivial remmaping in mutate.
- Provide function for cleaning the date range. To make this function even more annoying, we need range start and range end in separate columns, so cannot do it with a single mutate.
- Provide a function to clean the annotated percentages.
Date ranges
Turns out this is a lot more difficult that it looks. It would have been so easy if strptime allowed exclusions in the format string. Instead I had to use regex. Regex should have been easy for me but R’s implementation defied my expectations.
use$r1 <- "([A-Za-z]*) ([0-9]{1,2}).([0-9]{1,2}), ([0-9]{4})"
use$r2 <- "([A-Za-z]*) ([0-9]{1,2}) . ([A-Za-z]*) ([0-9]{1,2}), ([0-9]{4})"
use$r3 <- "([A-Za-z]*) ([0-9]{1,2}), ([0-9]{4})"

# There are three different date formats mixed in the dataset.
# This function identified the format by a number.
# 1. Intramonth, 2. Intermonth, 3. Single Day.
dateCase <- Vectorize(function(range) {
  if (grepl(use$r1, trimws(range) )) {
    return(1)
  } else if (grepl(use$r2, trimws(range) )) {
    return(2)
  } else {
    return(3)
  }
})

dateStrFrom <- Vectorize(function(range, case) {
  if (case==1) {
    sub(use$r1, "\\2-\\1-\\4", range )
  } else if (case==2) {
    sub(use$r2, "\\2-\\1-\\5", range )
  } else {
    sub(use$r3, "\\2-\\1-\\3", range )
  }
})

dateStrTo <- Vectorize(function(range, case) {
  if (case==1) {
    sub(use$r1, "\\3-\\1-\\4", range )
  } else if (case==2) {
    sub(use$r2, "\\4-\\3-\\5", range )
  } else {
    sub(use$r3, "\\2-\\1-\\3", range )
  }
})

# Take a tibble worksheet tibble and separate the range in Date column into two separate columns.
cleanDate <- function(df) {
  df %>%
    mutate(DateCase=dateCase(Date)) %>%
    mutate(DateFrom=dmy(dateStrFrom(Date,DateCase ))) %>%
    mutate(DateTo=dmy(dateStrTo(Date,DateCase ))) %>%
    select(-DateCase)
}
Combine and Transform
- Join the data sets
- Mutate for consistency
- Convert from wide to long format
use$ws$e2016preConvention <- use$ws$e2016preConvention %>%
  filter(stringr::str_detect(DemocraticCandidate, 'Hillary Clinton') & stringr::str_detect(RepublicanCandidate, 'Donald Trump'))


setYear <- function(date) {
  year(date) <- 2020
  date
}

use$combined <-
  use$ws$e2020 %>%
  dplyr::rename(Democrat = Biden, Republican = Trump) %>%
  plyr::rbind.fill(use$ws$e2016preConvention, use$ws$e2016postConvention) %>%
  cleanDate() %>%
  select(PollSource = "Poll source", DateFrom, DateTo, Democrat, Republican) %>%
  gather(Party, Percentage, Democrat:Republican) %>%
  mutate(Year=as.character(year(DateTo))) %>%
  mutate(ChartDate=setYear(DateTo)) %>%
  mutate(Key=paste(Party, Year)) %>%
  arrange(DateTo) %>%
  filter(Year %in% c(2020,2016)) %>%
  filter(Percentage < 1) %>%
  mutate(Percentage = as.numeric(Percentage))
## Warning: 1 failed to parse.
## Warning: 1 failed to parse.use$combined %>% head(4) %>% knitr::kable() | PollSource | DateFrom | DateTo | Party | Percentage | Year | ChartDate | Key |
|---|---|---|---|---|---|---|---|
| Fox News[400] | 2016-01-04 | 2016-01-07 | Democrat | 0.44 | 2016 | 2020-01-07 | Democrat 2016 |
| Fox News[400] | 2016-01-04 | 2016-01-07 | Republican | 0.47 | 2016 | 2020-01-07 | Republican 2016 |
| Morning Consult[398] | 2016-01-08 | 2016-01-10 | Democrat | 0.42 | 2016 | 2020-01-10 | Democrat 2016 |
| Gravis Marketing/One America News Network[399] | 2016-01-10 | 2016-01-10 | Democrat | 0.49 | 2016 | 2020-01-10 | Democrat 2016 |
Plot
ggplot(use$combined, aes(x=ChartDate, y=Percentage, color=Key)) +
geom_point(aes(shape=Key, alpha=0.75)) +
scale_color_manual(values=c("#aaaaff", "#0000aa", "#ffaaaa","#aa0000" )) +
scale_shape_manual(values = c(5, 16, 5,16)) +
scale_y_continuous(labels = scales::percent_format(accuracy=1)) +
geom_smooth( method = loess,  formula = y ~ x, aes(linetype = Year), show.legend = FALSE) +
scale_linetype_manual(values=c("twodash", "solid")) +
guides(alpha = F, Key = T)  +
theme_tq() 
Testing
case1 <- "June 28–29, 2016"
case2 <- "September 26 – October 2, 2016"
case3 <- "Jun 23, 2020"


assertthat::assert_that(dateCase(case1) == 1)
## [1] TRUEassertthat::assert_that(dateCase(case2) == 2)## [1] TRUEassertthat::assert_that(dateCase(case3) == 3)## [1] TRUEassertthat::are_equal(
dmy(dateStrFrom(case1, dateCase(case1))),
ymd("2016-06-28"))## [1] TRUEassertthat::are_equal(
dmy(dateStrTo(case1, dateCase(case1))),
ymd("2016-06-29"))## [1] TRUEassertthat::are_equal(
dmy(dateStrFrom(case2, dateCase(case2))),
ymd("2016-09-26"))## [1] TRUEassertthat::are_equal(
dmy(dateStrTo(case2, dateCase(case2))),
ymd("2016-10-2"))## [1] TRUE